NeuroVista Trial Data
The NeuroVista Trial Data is one-of-a-kind long-term intracranial electroencephalography data with recordings between 6 months to 3 years in duration for 15 patients.
How it works
1. Register and accept the terms and conditions.
2. Get the data.
3. Create and share algorithms.
4. Participate in benchmarking of algorithms.

Data
Background
There is emerging evidence that the temporal dynamics of brain activity can be classified into 4 states: Interictal (between seizures, or baseline), Preictal (prior to seizure), Ictal (seizure), and Post-ictal (after seizures). Seizure forecasting requires the ability to reliably identify a preictal state that can be differentiated from the interictal, ictal, and postictal state. The primary challenge in seizure forecasting is differentiating between the preictal and interictal states. The main goals of this ecosystem are to advance the accurate classification of the preictal brain state in humans with epilepsy and to advance our understanding of epilepsy.
What Data Is Available And How To Access It
Two datasets are currently available. The first contains the seizure data from the Melbourne-NeuroVista seizure trial, useful for the study of seizures and seizure mechanisms. The second dataset contains interictal and preictal data from the Melbourne-NeuroVista seizure trial and the Melbourne-University AES-MathWorks-NIH Seizure Prediction Challenge for the purposes of advancing seizure prediction research.
Melbourne Seizure Prediction Trial Seizure Data
The ictal data for 12 subjects recorded during the Melbourne-NeuroVista seizure trial is available for download after completing the registration form. After registering you will be emailed an invitation to download the data from figshare. The data are licensed under a Creative Commons license (see the Terms and Conditions for further detail).
Melbourne-University AES-MathWorks-NIH Seizure Prediction Challenge Data
Once you have registered and accepted the terms and conditions, data will be accessible through the Seer Platform. Download of the data requires use of a Python-based API available on GitHub (for best results use the latest version) and a Seer username and password for login (see registration page for details on how to register). We ask all users to use the Python API to download data and store it to file once, rather than merging the API into your prediction algorithm or analysis code and unnecessarily repeatedly downloading large amounts of data. Instructions on how to use the API are provided in the 'readme.md' file on GitHub. For each dataset made available here on the ecosystem, the API is accompanied by specific scripts in the ‘Examples’ folder contained in the GitHub package that can be used to facilitate download of that dataset. For example, for the contest dataset the ‘neurovista_contest_data_downloader.py’ script can be used to download the contest data.
In addition to the API data downloader, users can view the data on the Seer web-browser-based data viewer, which also requires a Seer username and password for login. The viewer can be accessed https://app.seermedical.com/au (note you must access the Australian ‘/au’ site to access the data; other international sites will not work). Simply login and select 'Studies'.

Choose the patient study you would like to see (e.g. 'Pat1Train').

This will load a metadata page for that study.

Now select 'Data' to view the raw EEG data.
Regarding the contest data, the contest data are available as 10 minute EEG segments laid out along a study timeline. The interictal segments start on the hour in the study timeline and preictal segments occur at half past the hour in the study timeline. Therefore, gaps in the data can appear in the study timeline and users should be aware of this when scrolling through, or searching for, data. Segments are aligned in this fashion because in the contest timing information of the segments was not provided. Timing information of segments will only be made available for algorithms invited to participate in the annual evaluation of top algorithms (see benchmarking).
In the 'Data' page of the data viewer, raw EEG data can be seen in 10 second blocks via manual or automatic scrolling. To manually scroll through the EEG data, click on the study timeline at the bottom. Below the study timeline is the label timeline. The label timeline shows when labels appear in the data and can help you find specific data segments. E.g. specific interictal or preictal segments can be found by clicking on the label timeline to find the index of that segment - i.e. 'interictal(158') in the image below indicates the 158th interictal segment is displayed. For the contest data, the label timeline only appears for the training data.

Queries on how to use the data viewer or data downloader can be addressed by contacting our team.
The Contest Data Challenge
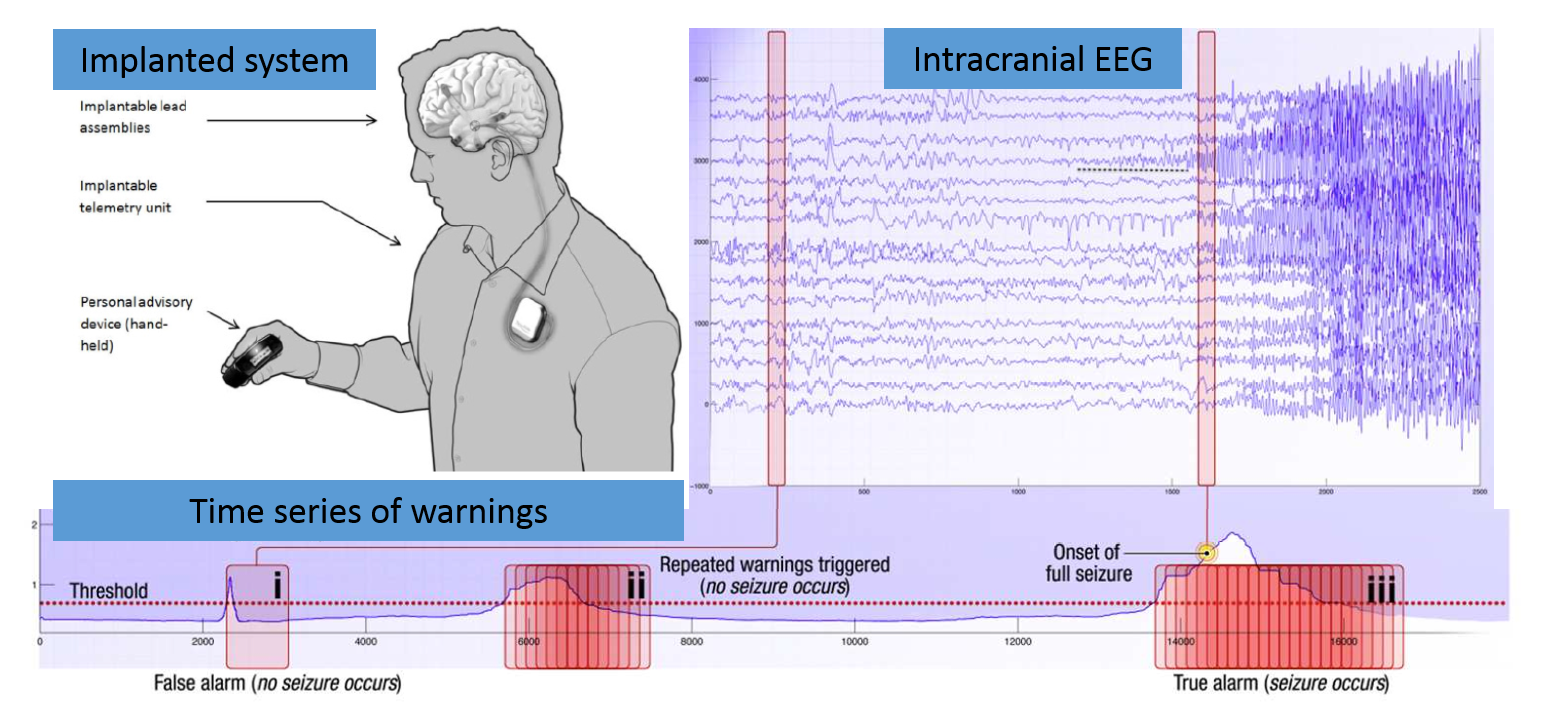
Human brain activity was recorded in the form of intracranial EEG (iEEG) which involves electrodes positioned on the surface of the cerebral cortex and the recording of electrical signals with an ambulatory monitoring system. iEEG was sampled from 16 electrodes at 400 Hz, and recorded voltages were referenced to the electrode group average. These are long duration recordings, spanning multiple months up to multiple years and recording large numbers of seizures in some humans.
The challenge is to distinguish between ten minute long data clips covering an hour prior to a seizure, and ten minute iEEG clips of interictal activity. Seizures are known to cluster, or occur in groups. Patients who typically have seizure clusters receive little benefit from forecasting follow-on seizures. Only lead seizures, defined here as seizures occurring four hours or more after another seizure, are included in the training and testing data sets. In order to avoid any potential contamination between interictal, preictal, and post-ictal EEG signals, interictal data segments were restricted to be at least four hours before or after any seizure. Interictal data segments were chosen at random within these restrictions.
Contest Dataset
As mentioned above the contest data can be downloaded using the Python API available on GitHub. Within the ‘Examples’ folder of the GitHub package is a script called ‘ContestDataDownloader.py' that utilises the ‘seerpy’ module in the package to download the contest data. This python script contains comments giving basic instructions about how the data downloader works. The data downloader can be configured to download and store the data segments as .mat (matlab), .hdf5 or .csv formats. The iEEG data segments are downloaded to folders containing training and testing data for each human patient. The default for the data downloader is to download all the data for the patients and training/testing sets specified in the ‘studies’ list defined in the ‘ContestDataDownloader.py' script. If connection breaks occur during data download, then users will likely need to modify the script to download specific ranges of data segments. Specific file segments can be selected for download by modifying the variables ‘segmentMin’ and ‘segmentMax’. The training data is organized into ten minute EEG clips labeled "Preictal" for pre-seizure data segments, or "Interictal" for non-seizure data segments. Training data segments are numbered sequentially, while testing data are in random order. Within folders data segments are stored in files with filenames as follows:
• PatITrain_J_K - the Jth training data segment corresponding to the Kth class (K=0 for interictal, K=1 for preictal) for the Ith patient (there are three patients).
• PatITest_J_0 - the Jth testing data segment corresponding to the Ith patient. (Note 0 in the filename does not indicate any class).
Preictal training and testing data segments are provided covering one hour prior to seizure with a five minute seizure horizon. (i.e. from 1:05 to 0:05 before seizure onset.) This pre-seizure horizon ensures that 1) seizures could be predicted with enough warning to allow administration of fast-acting medications, and 2) any seizure activity before the annotated onset that may have been missed by the epileptologist will not be considered as preictal.

Similarly, one hour sequences of interictal ten minute data segments are provided. The interictal data were chosen randomly from the full data record, with the restriction that interictal segments be at least 4 hours away from any seizure, to avoid contamination with preictal or postictal signals. It is possible to determine which 10 minute segments belong to specific 1 hour blocks for the training data by grouping every 6 blocks based on the index J in 'PatITrain_J_K' (i.e. block index = ceil(J/6) ). Determining the position of a segment within a block can be done using the modulus operator (i.e. segment position = ((J-1) % 6)+1 ). This procedure does not apply for the testing data. For preictal training segments 'PatITrain_J_1' for J > 150 this method cannot be applied either and these segments can be viewed as extra files and it is up to the user if they wish to use them in training.
Any part of any 10-minute data segment can potentially contain “data drop-out” where the intracranial brain implant has temporarily failed to record data. This data drop-out corresponds to iEEG signal values of zeros across all channels at a given time sample. Data drop-out provides no predictive information as to whether a given 10-minute segment is preictal or interictal. A handful of 10-minute segments contain 100% data drop-out and cannot be classified. The data may also contain artifacts such as large amplitude rapid signal transitions that can be removed from analysis.
The class labels for the training and testing sets are provided as separate files:
• contest_train_data_labels.csv – training set labels for all patients
• contest_test_data_labels_public.csv – test set labels for all patients, however, only the ‘public’ test set (30% of the test set) labels from the ‘Melbourne-University AES-MathWorks-NIH Seizure Prediction Challenge’ are provided. In the challenge, the ‘public’ test set was used to score algorithms during the contest, while the remaining test set, called the ‘private’ test set, was used to determine the winners at the end of the competition. To obtain the full set of test set class labels and participate in the benchmarking process please contact Dr Levin Kuhlmann (levin.kuhlmann@monash.edu).
As indicated in the terms and conditions, the contest data may only be used for non-commercial purposes.
Algorithms
We want people to find the best seizure prediction algorithms so that seizure prediction can be made a reality for patients worldwide.
Towards this end a GitHub.com organisation has been created to facilitate the open public sharing of seizure prediction algorithms and is accessible at https://github.com/epilepsyecosystem. This organisation is publicly accessible, requires separate registration with GitHub.com and takes advantage of all of GitHub’s features such as easy code sharing, a discussion forum to share ideas, and a thriving community of coders. The code for the top algorithms from the ‘Melbourne-University AES-MathWorks-NIH Seizure Prediction Challenge’ are publicly available at https://github.com/epilepsyecosystem. To share code on https://github.com/epilepsyecosystem you must contact Dr Levin Kuhlmann (levin.kuhlmann@monash.edu) to be invited to become a member of the GitHub organisation.
How will the best algorithms be found?
While algorithms will be shared and evolved on GitHub.com, people are encouraged to use the contest data and the ecosystem’s benchmarking procedure.
Benchmarking
Finding the best seizure prediction algorithms
The top performing algorithms from the ‘Melbourne-University AES-MathWorks-NIH Seizure Prediction Challenge’ have provided an initial set of benchmarking algorithms. In the contest the test set was divided up into a public test set (30% of the test set), used to rank algorithms until the end of the contest, and a private test set (70% of the test set), used to determine the winners at the end of the contest.
People participating in Epilepsyecosystem.org are encouraged to train their algorithms on the contest data with knowledge of the training and public test set labels, then contact Dr Levin Kuhlmann (levin.kuhlmann@monash.edu) to submit their complete test set predictions (predictions should be scaled between 0 to 1 as an estimate of preictal probability) using a solution file and obtain Area Under the Curve (AUC) performance scores for their algorithm for the private test set (as per the terms and conditions). Algorithms are ranked on the evolving ecosystem leaderboard.
The Incentive - The Ultimate Benchmark
The top algorithms in the ecosystem will have the opportunity of being annually evaluated on the full dataset of 15 patients from the NeuroVista trial. The contest data represents a subset of data from 3 patients from the trial. Evaluating algorithms on the full trial dataset will help us to find the best algorithms for the widest range of patients and motivate larger scale clinical trials of seizure prediction devices. The ecosystem organisers will invite the top teams to submit their code for independent evaluation on the full dataset.
To participate in the ultimate benchmark test, people are required to:
Prepare algorithms with Python 3 (preferably using Anaconda).
This will ensure a standardised evaluation of seizure prediction performance and computational efficiency of the algorithms.
Make algorithms efficient such that the time taken to classify a 10 minute data segment is at most 30 seconds on a single core.
This duration needs to include all feature calculation and classification steps of a pretrained algorithm.
Make algorithms that utilise at most 100 MB of RAM when classifying a 10 minute data segment.
Submit code so that your algorithm can easily be retrained and tested on new data (using the same filename structure given for the contest data) and different data segment file durations by the independent evaluator.
The full details of how to configure your code for the independent evaluation are given here.
Evaluation of performance of algorithms on the full trial dataset will also include weighting of algorithms by (time-varying) factors, such as circadian and other multidien information, interictal spike rates and/or temperature of each patient’s local region of residence. This will help to find new ways to tailor patient-specific algorithms. In addition, performance will be evaluated on different seizure types within a patient to give insight into the role seizure types play in seizure prediction.