My Seizure Gauge Data
The My Seizure Gauge Data is a unique wearable device dataset with long-term recordings from people with epilepsy. The data was collected with funding support from the Epilepsy Foundation of America for the purpose of developing seizure prediction algorithms for non-invasive wearable devices.
How it works
1. Register and accept the terms and conditions.
2. Get the data.
3. Create and share algorithms.
Data & Algorithms
Data
Background
The new frontier for epilepsy monitoring and seizure prediction is non-invasive wearable devices. The My Seizure Gauge data affords a unique opportunity to develop new algorithms for epilepsy monitoring, seizure detection and seizure prediction. Why use this dataset and not another one? This dataset provides long-term recordings of epilepsy patients which means there are more seizures per patient and this offers more data to develop reliable patient-specific algorithms.
Prior work on epilepsy monitoring and seizure prediction has revealed evidence that the temporal dynamics of recorded brain activity can be classified into 4 states: Interictal (between seizures, or baseline), Preictal (prior to seizure), Ictal (seizure), and Post-ictal (after seizures). Seizure prediction requires the ability to reliably identify a preictal state that can be differentiated from the interictal, ictal, and postictal states. Typically, seizure forecasting focuses more specifically on differentiating between the preictal and interictal states. The main goals of Epilepsyecosystem are to advance the accurate classification of the preictal state in humans with epilepsy and to advance our understanding of epilepsy.
Recording brain activity can be an invasive process and therefore there is strong desire to assess the utility of non-invasive wearable devices for epilepsy monitoring, seizure detection and seizure prediction that can leverage other types of biosignals besides brain activity. The My Seizure Gauge data has been made available for this purpose.

What Data Is Available And How To Access It
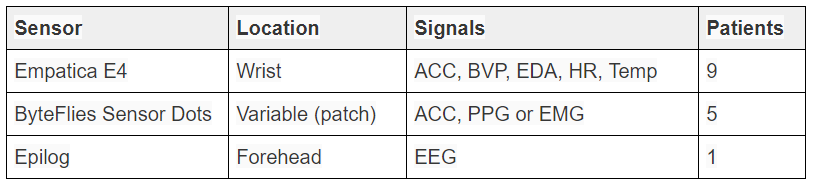
Continuous wearable device recordings from 10 patients are provided along with seizure times and metadata about the recordings (number channels, channel/biosignal types, sampling rate, total samples per recording, and timestamps). Between 3-5 days of data are provided per patient. Data for different devices and patients will be added as it comes available. Currently, data are provided from 3 devices: Empatica E4 (9 patients), Byteflies Sensor Dot (5 of the patients) and Epilog (1 patient). Each E4 device records accelerometry (ACC), blood volume pulse (BVP), electrodermal activity (EDA), heart rate and temperature. The Sensor Dot records accelerometry and electromyography (EMG) or 3-channel (red, green, IR) photoplethysmography (PPG). The Epilog device records single-channel EEG.
Once you have registered and accepted the terms and conditions, data will be accessible through the Seer Platform. Download of the data requires use of a Python-based API called ‘Seer-Py’ available on GitHub, as well as additional Python scripts also available on Github, and a Seer username and password for login (see registration page for details on how to register). We ask all users to use the Python API to download data and store it to file once, rather than merging the API into your prediction algorithm or analysis code and unnecessarily repeatedly downloading large amounts of data. Instructions on how to use the API are provided in the 'readme.md' files on GitHub.
Users should run msg_data_downloader.py to initiate download of the dataset. It will download the timeseries data, seizure timing information and other metadata.
In addition to the API data downloader, users can view the data on the Seer web-browser-based data viewer, which also requires a Seer username and password for login. The viewer can be accessed at https://app.seermedical.com/au (note you must access the Australian ‘/au’ site to access the data; other international sites will not work). Simply login and select 'Studies'.

Choose the patient study you would like to see (e.g. 'MSEL_01842').

This will load a metadata page for that study that indicates the channel types, sampling rate, etc.
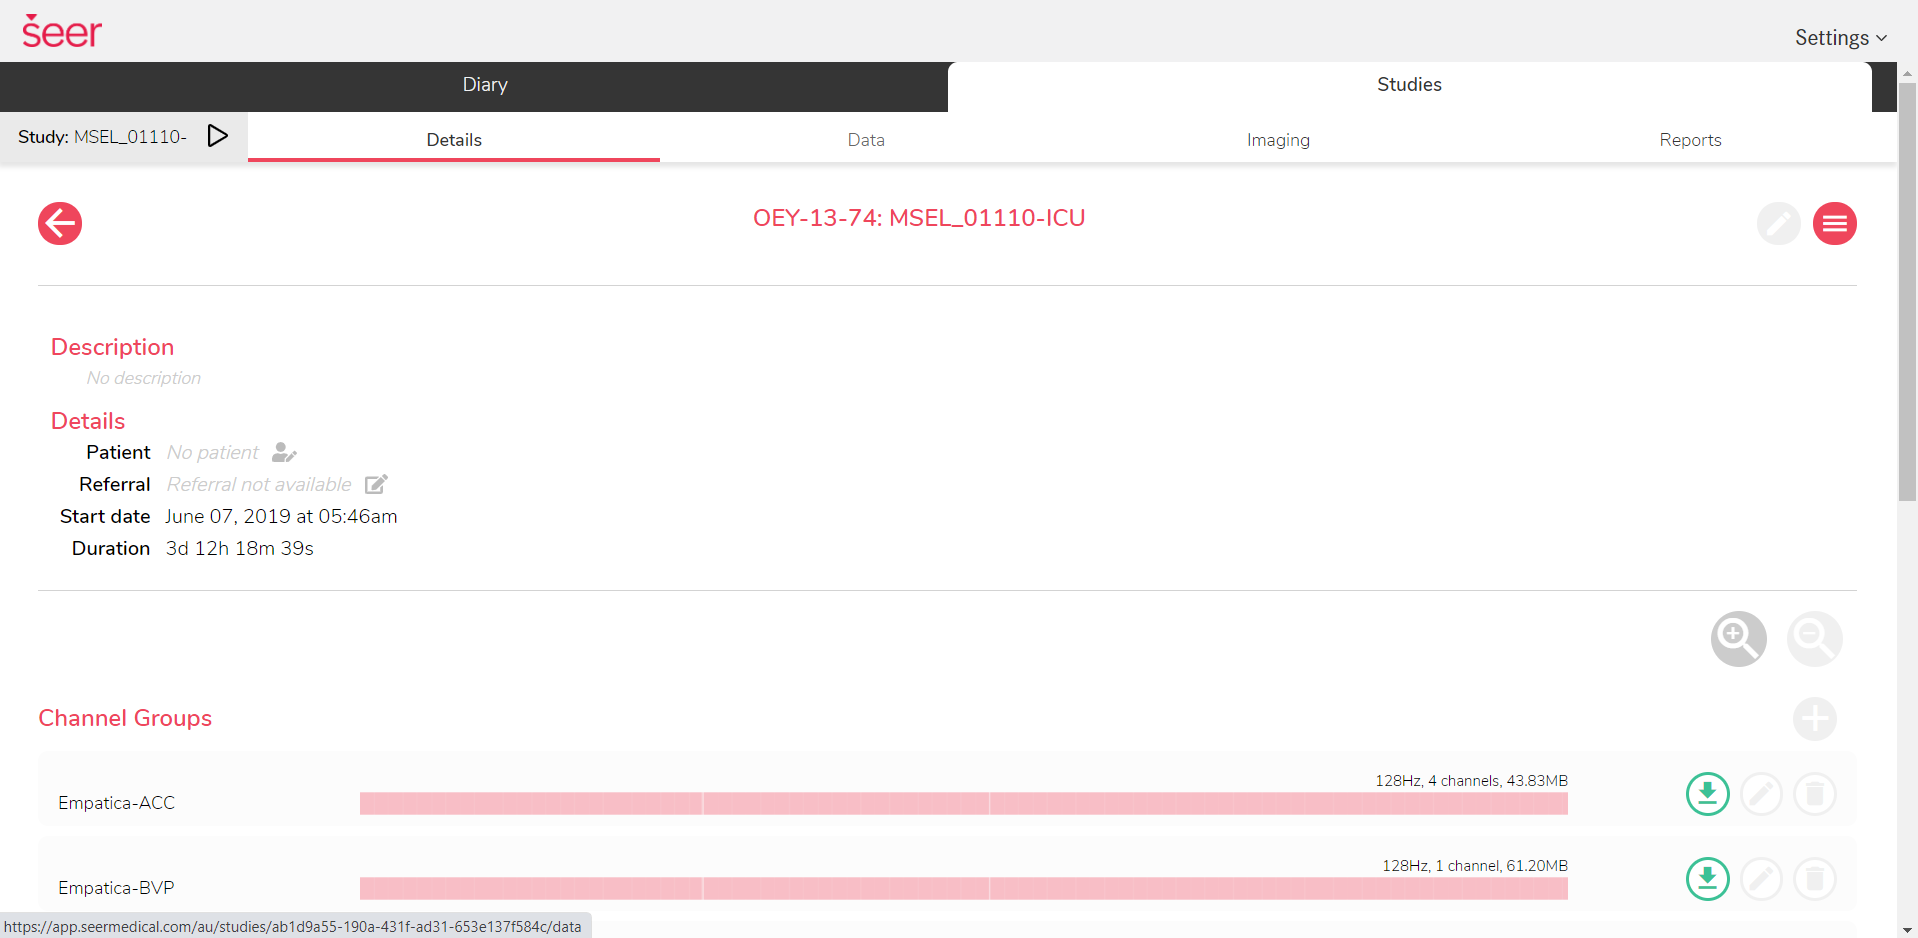
Now select 'Data' to view the raw data.
In the 'Data' page of the data viewer, raw wearables data can be seen via manual or automatic scrolling. To manually scroll through the data, click on the study timeline at the bottom or use the left and right arrow keys. In the bottom part of the study timeline is the label timeline. The label timeline shows when seizures (from onset to offset) appear in the data and can help you find the data that corresponds to these seizures or just beforehand.

Queries on how to use the data viewer or data downloader can be addressed by contacting our team.
As indicated in the terms and conditions, the My Seizure Gauge data may only be used for non-commercial purposes.
Algorithms
We want people to develop the best seizure prediction algorithms so that seizure prediction can be made a reality for patients worldwide.
Towards this end a GitHub.com organisation has been created to facilitate the open public sharing of seizure prediction algorithms and is accessible at https://github.com/epilepsyecosystem. This organisation is publicly accessible, requires separate registration with GitHub.com and takes advantage of all of GitHub’s features such as easy code sharing, a discussion forum to share ideas, and a thriving community of coders. The code for the top algorithms from the ‘Melbourne-University AES-MathWorks-NIH Seizure Prediction Challenge’ are publicly available at https://github.com/epilepsyecosystem. When you register with Epilepsyecosystem you will be invited to join the discussion or share code on https://github.com/epilepsyecosystem. This GitHub organisation is also a useful forum for discussing the My Seizure Gauge data.